
22 Mar Do You Live in an Area that is Susceptible to Liquefaction?
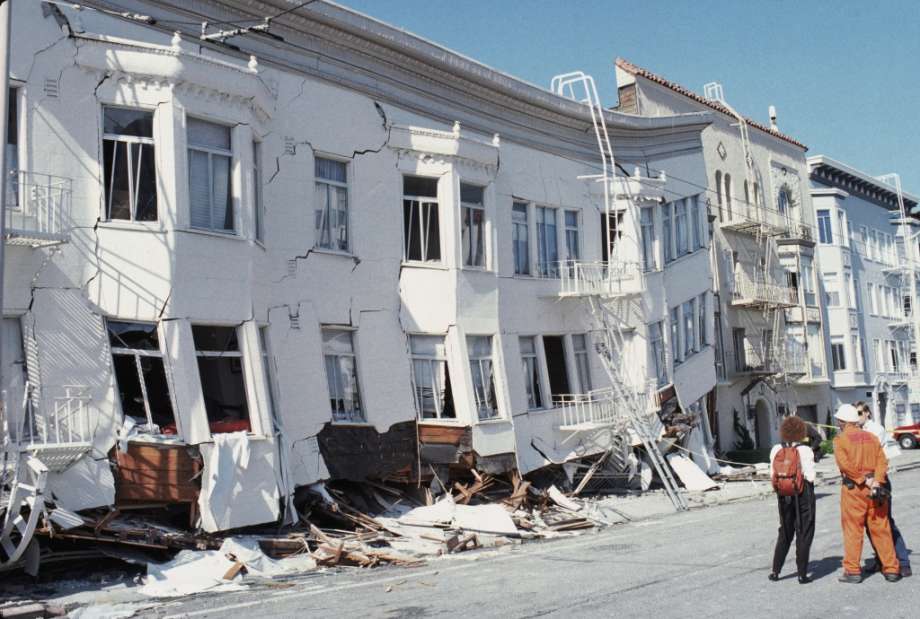
1989 Loma Prieta Earthquake – SF Gate
Curious about the impact that liquefaction could have on our homes should we experience a major earthquake I felt compelled to research this topic and identify the areas in Marin that are most susceptible to this phenomenon. What triggered this question was the extensive rainfall we received this year that led to flooding, landslides, and generally soggy and unsafe conditions, and the knowledge that many marshes and creeks that historically flowed throughout Marin have been filled over the years to enlarge cities, create subdivisions, and build homes. To assist me with this project I consulted the ABAG Resilience Programs website and studied the detailed color coded maps that pinpoint those areas most susceptible to liquefaction and shaking. These maps highlight the different potential levels of shaking severity and liquefaction susceptibility.
Here is the link to the maps: http://gis.abag.ca.gov/website/Hazards/?hlyr=liqSusceptibility
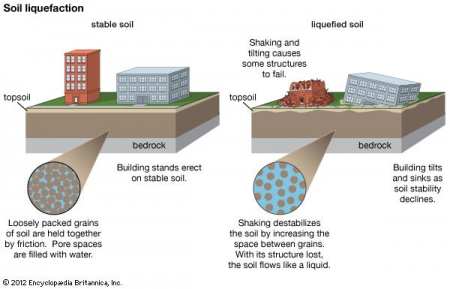
What is soil liquefaction? The USGS defines liquefaction as follows:
Soil liquefaction, also called earthquake liquefaction is a phenomenon that occurs in water-saturated unconsolidated soils affected by seismic S waves (secondary waves), which cause ground vibrations during earthquakes. Poorly drained fine-grained soils such as sandy, silty, and gravelly soils are the most susceptible to liquefaction. When earthquake shock occurs in waterlogged soils, the water-filled pore spaces collapse, which decreases the overall volume of the soil. This process increases the water pressure between individual soil grains, and the grains can then move freely in the watery matrix. This substantially lowers the soil’s resistance to shear stress and causes the mass of soil to take on the characteristics of a liquid.
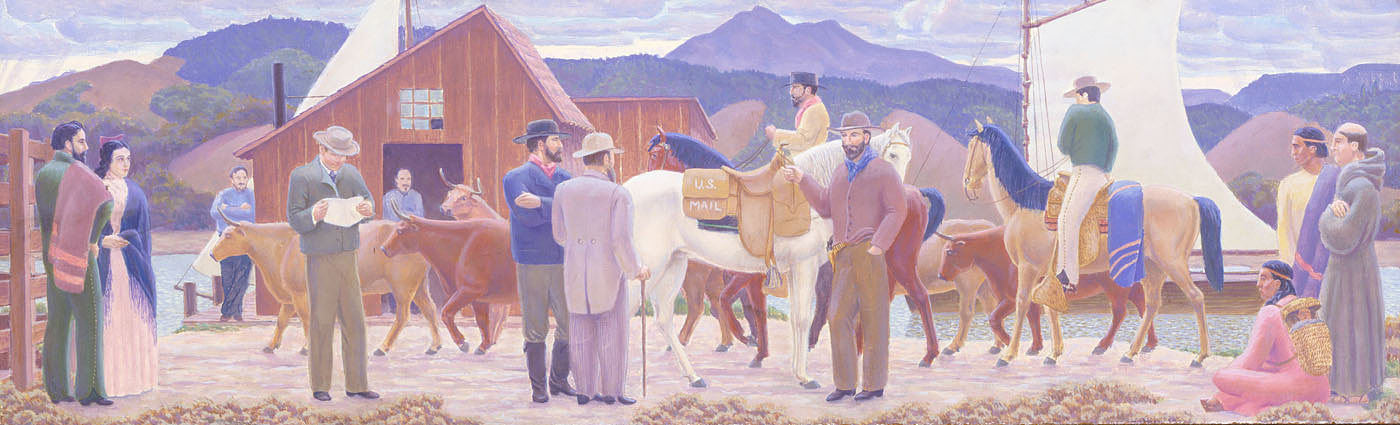
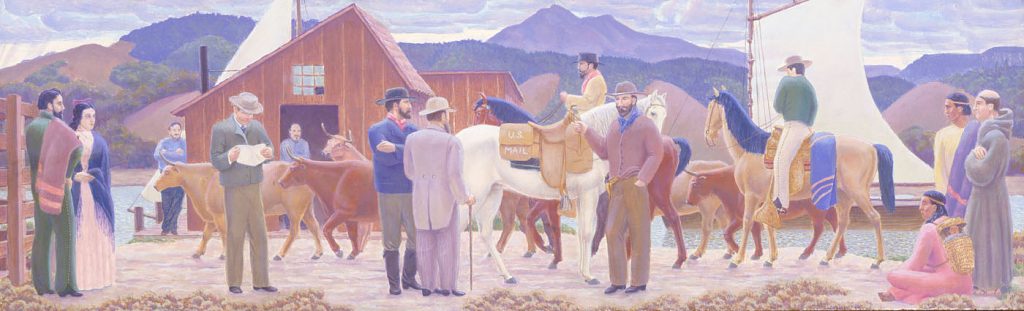
The famous 1937 mural painted by Oscar Galgiani hanging in the San Rafael Post Office is a good reminder of just how far inland the San Rafael Creek once flowed and why we should have concerns about liquefaction. This mural is of a circa 1851 trading post on the San Rafael Creek near the present day location of the San Rafael Post Office. The mural shows just how large this body of water really was and how far inland it flowed!
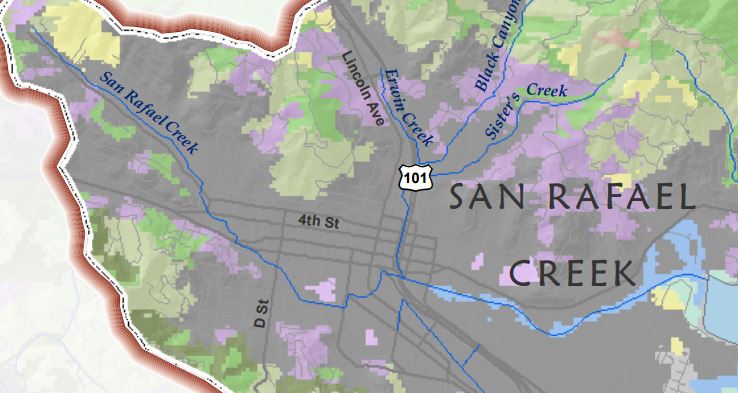
In fact, the map below shows that the San Rafael Creek originated near the border with San Anselmo and flowed through San Rafael south of Fourth Street and out through the channel which still exists on the east side of Highway 101. In the color coded maps at the end of this article you will see that there are areas to the North and South of the Miracle Mile near Greenfield Avenue in San Rafael and San Anselmo are very high susceptibile to liquefaction and shaking because the creek likely flowed through this area. Who knew?
Another great example of land filled areas that once contained a lot of water is found in this early 1900’s photograph of Tamalpais High School. Notice how the water originally went right up to the steps of the school. Back in those days you could actually take a boat to school!

A Note to Homeowners
In 1998 California passed a law mandating that sellers disclose to buyers whether their property is located in a special flood hazard area, dam failure inundation area, earthquake fault zone, seismic hazard zone, high fire severity area or a wildland fire area (Natural Hazzards Disclosure Statement – NHDS). This disclosure requirement applies to all real estate transactions, including residential resales, new subdivision sales and commercial property transactions. So if you bought your home after this law was passed you would have received a NHDS from the seller disclosing potential hazards in your area. If you don’t remember seeing it or are concerned about your particular situation you can order a report for approximately $100 from one of the service providers (contact me and I will help you).
I encourage you to do your own research. You may find the results as surprising as I did. Click on the link below, enter the name of your city, then compare the legend to the color coded map.
http://gis.abag.ca.gov/website/Hazards/?hlyr=liqSusceptibility
No Comments